
Five Clocks, One Empire: A Converging Multipolar World challenging the American Hegemony



Introduction
As the Iran conflict drags on, Washington finds itself confronting a convergence of pressures that threaten to reshape the global order. What was anticipated as a brief military engagement in Iran has stretched into a prolonged conflict, with the Strait of Hormuz effectively closed for over two months. This disruption has sent ripples through global energy markets, financial systems, and geopolitical alliances. As oil prices hover above $105-110 per barrel and inflation reaccelerates, multiple clocks are ticking in unison, each representing a distinct but interconnected challenge to U.S. economic stability, fiscal policy, and strategic dominance.
These clocks spanning Japanese bond markets and the yen carry trade, U.S. Treasury yields, looming crude oil shortages, accelerating de-dollarization efforts, and impending domestic political backlash paint a picture of an overstretched superpower navigating the limits of its influence. Investors, central bankers, and foreign governments are watching closely, positioning themselves for scenarios that could culminate in market volatility, liquidity crunches, or even a broader reconfiguration of global power. The coming months, particularly the critical window from late June through November 2026 and beyond, could prove decisive.

Clock 1: Japanese Bond Markets and the Unwinding Of Yen Carry Trade
The first clock ticking against Washington originates in Tokyo, where Japanese Government Bond (JGB) yields have surged to historic levels, signalling the end of an era of ultra-loose monetary policy and threatening the stability of global capital flows. The 30-year JGB yield, for a bond first launched in 1999, has crossed the 4.10 percent threshold and continues to climb almost vertically in recent months. Even the benchmark 10-year JGB yield has risen steadily, reflecting deep shifts in market expectations. For decades, Japan maintained some of the world’s lowest interest rates, a policy that fuelled the massive yen carry trade. Investors borrowed yen at negligible costs and deployed those funds into higher-yielding assets abroad, particularly U.S. Treasuries, creating a steady source of demand for American debt.
Now, the Bank of Japan (BoJ) is normalizing policy amid rising inflation driven by energy costs and supply chain disruptions linked to the Hormuz crisis. This shift has made yen-denominated debt far more expensive to service, eroding the arbitrage opportunities that underpinned the carry trade. Despite aggressive interventions by the BoJ pushing the USD/JPY exchange rate from peaks near 161 down toward 155-156 the pair has rebounded sharply to around 159, underscoring the limits of intervention in the face of fundamental pressures. Japanese investors have responded by accelerating sales of foreign bonds. Net sales of US treasury bonds by Japanese institutions, and local authorities totalled ¥4.67 trillion, or approximately $29.6 billion, in the three months ended March 31. This represents the highest quarterly outflow since the second quarter of 2022 and marks one of the most significant episodes of U.S. Treasury selling by Japan in recent years.
U.S. officials, including Treasury Secretary Bessent and the Federal Reserve, have been actively engaged in backstopping efforts to prevent a disorderly unwind. A sudden reversal of the yen carry trade risks contagion into U.S. bond markets through forced liquidations and margin calls on overleveraged hedge funds. Yet the crisis is compounded by domestic Japanese dynamics of rising inflation and a potential of further rate hikes by Bank of Japan could diminish the appeal of foreign investments. As Japanese yields climb, the incentive to hold U.S. debt weakens, reducing a key pillar of foreign financing for America’s massive deficits. This dynamic limits Washington’s flexibility at a moment when domestic borrowing needs are surging.
The interplay between BoJ normalization and global energy-driven inflation creates a feedback loop that Washington can influence only marginally through interventions and swap lines. Should the Japanese selling intensify, it could amplify upward pressure on U.S. yields, constraining monetary policy options and raising borrowing costs across the American economy. This clock is ticking relentlessly, as each basis point increase in JGB yields narrows the window for a soft landing in global markets.
As the Iran war drags on and soaring oil prices trigger sharp currency volatility across Asia, both traditional allies and strategic competitors have already begun reducing their exposure to U.S. Treasuries. In March 2026, China cut its holdings to $652.3 billion the lowest level since 2008 while Japan, despite remaining the largest foreign holder, trimmed nearly $47 billion. Overall foreign holdings of U.S. Treasuries declined sharply to $9.25 trillion in March from $9.49 trillion in February, signalling growing caution and a broader erosion of confidence amid geopolitical turbulence, persistent inflation risks, and questions over America’s long-term fiscal and strategic predictability. This coordinated pullback underscores a system under strain, where even close partners feel compelled to diversify and protect their reserves.
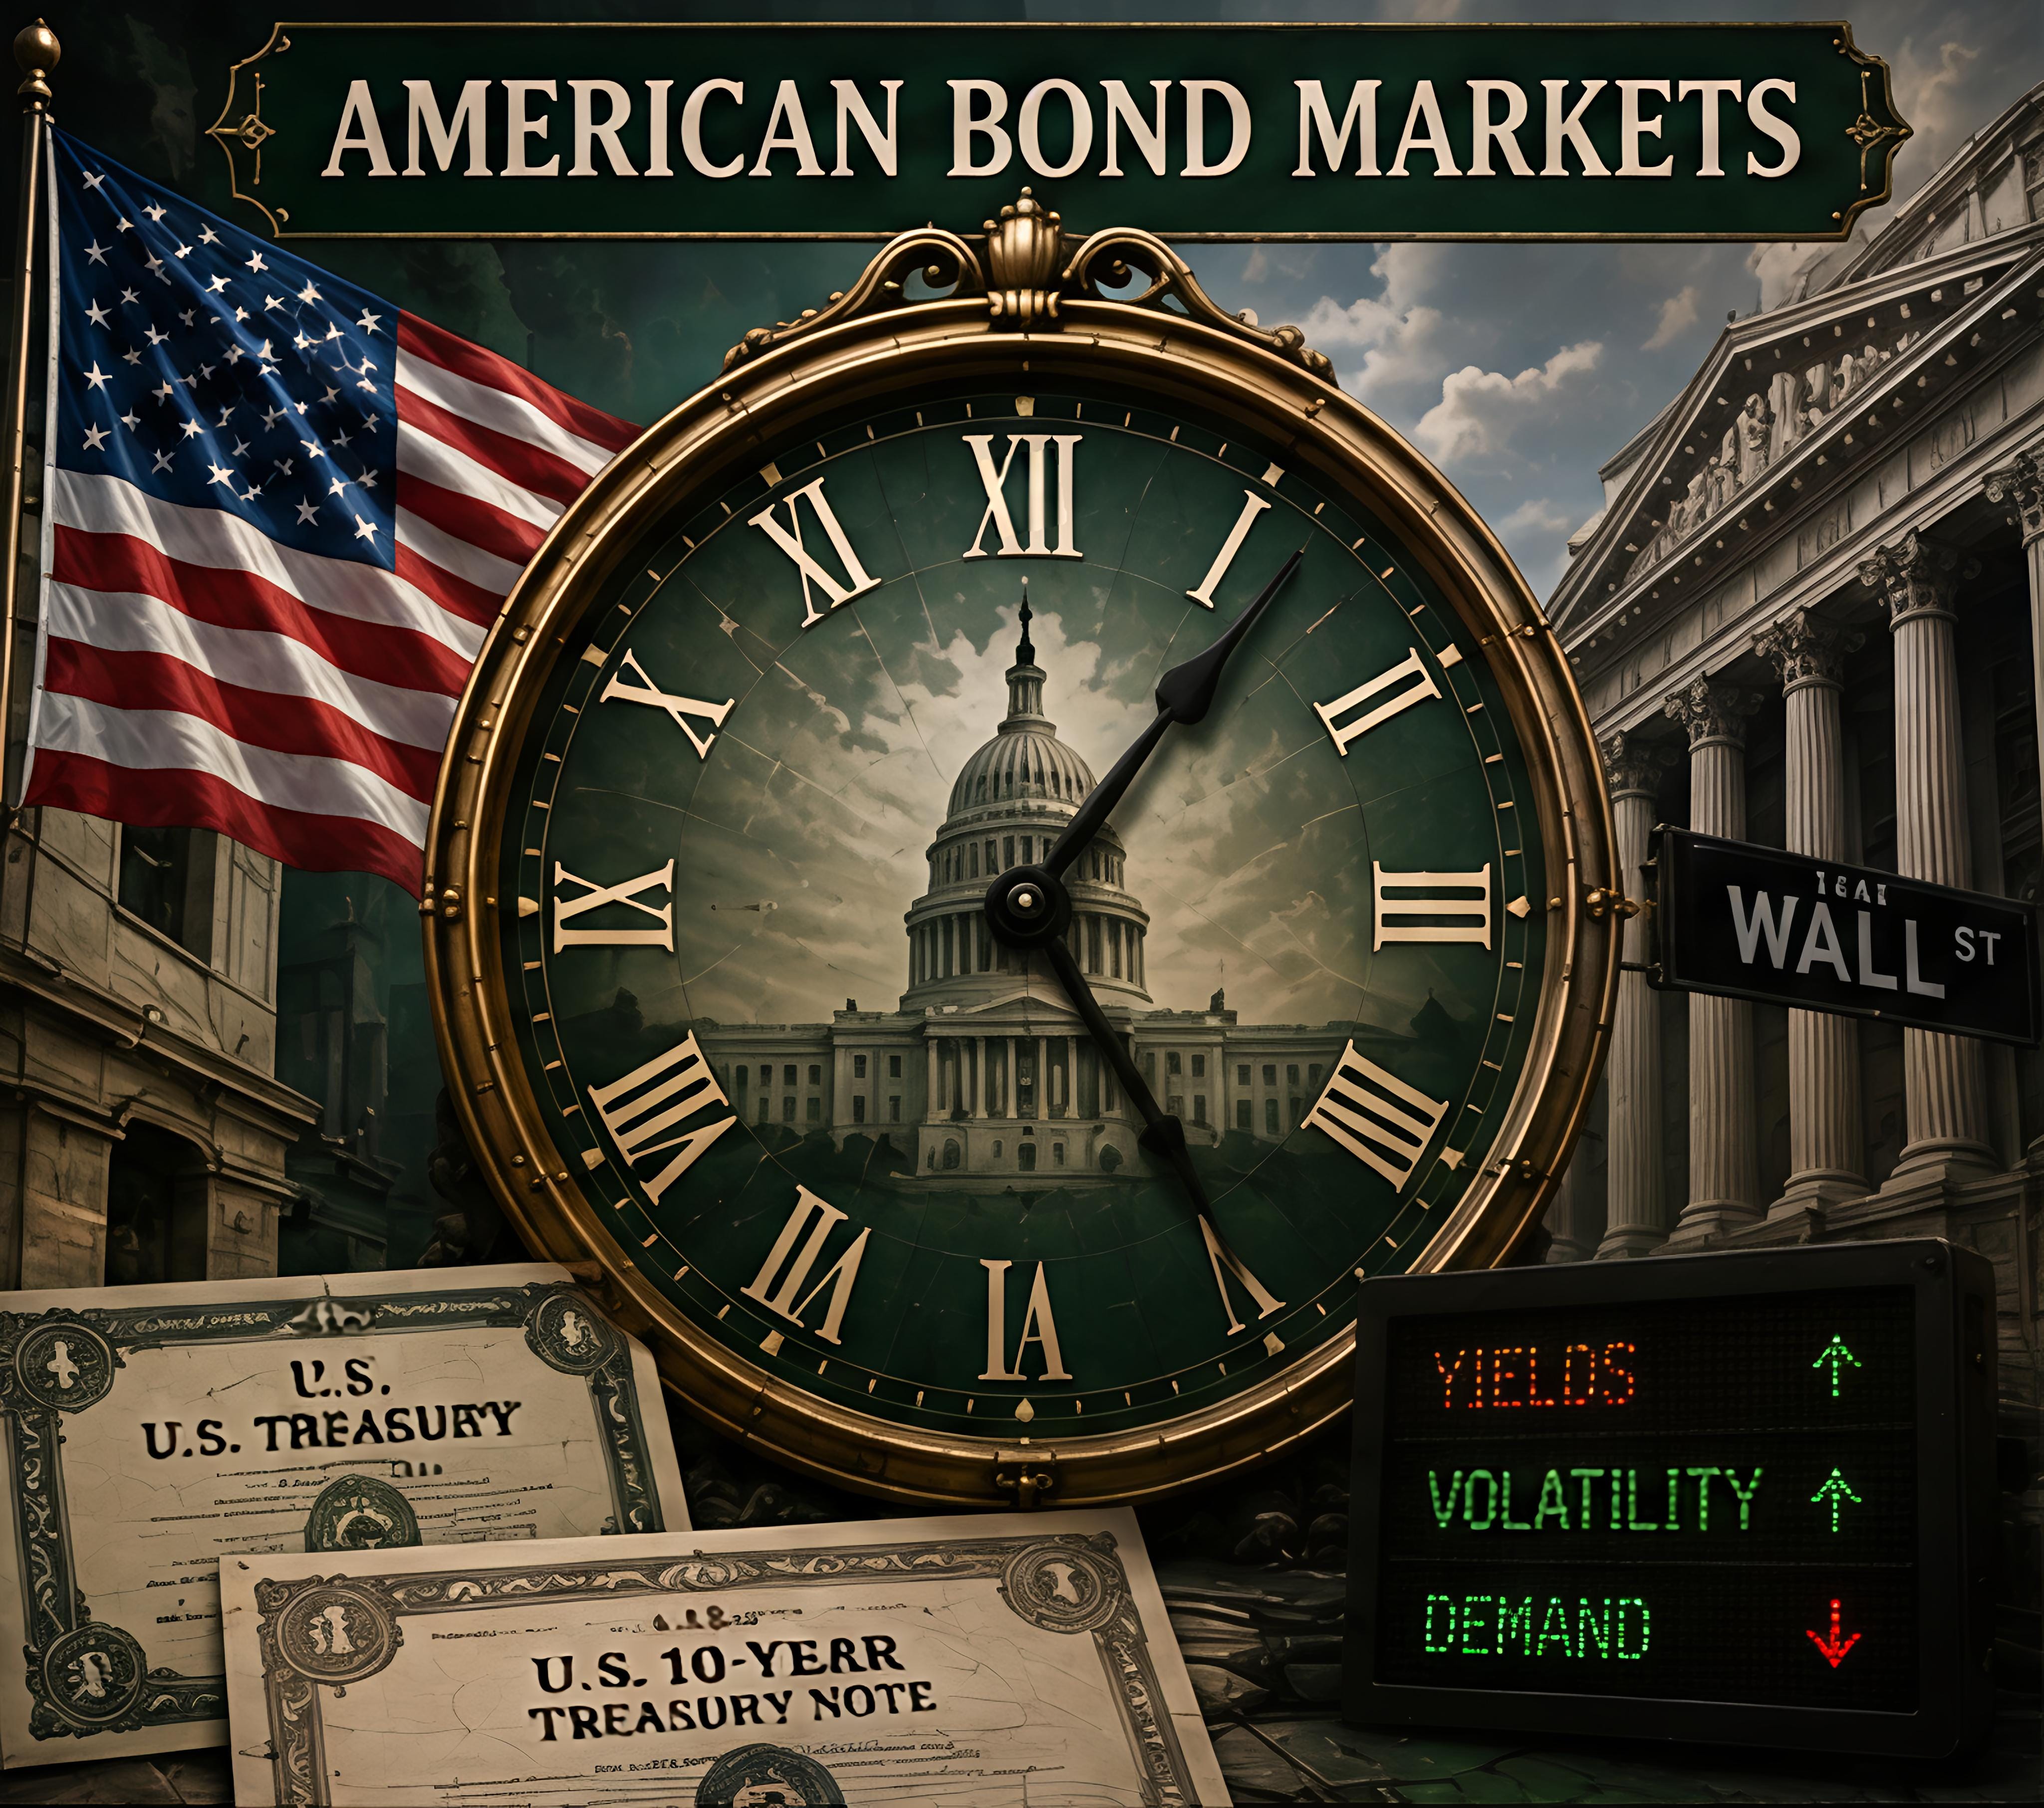
Clock 2: Red Flags in the U.S. Bond Market
Compounding the external pressure from Japan is a second clock sounding alarms within the U.S. Treasury market itself. As the Iran conflict drags on, inflation fuelled by Hormuz disruptions is cracking the foundations of confidence in U.S. government debt. Producer Price Index (PPI) inflation has climbed to 6.0 percent, while Consumer Price Index (CPI) has reached 3.8 percent both the highest levels since 2023. Gasoline prices have surged past $5 per gallon in several states, with national averages exceeding $4. Jet fuel costs are up 58 percent, gasoline 52 percent, and fertilizer prices 20 percent since the conflict intensified. These spikes reflect the real economic pain of disrupted energy flows.
Treasury yields have responded to this supply chain shock dramatically. The 10-year, 20-year, and 30-year yields have climbed to fresh highs, with increases of 3 to 4 basis points in single sessions. The 30-year yield has officially hit 5.19 percent, its highest level since July 2007. Prior to the escalation in Iran, the 10-year yield had eased to 3.92 percent amid hopes of cooling inflation. Just 80 days later, it has risen by approximately 75 basis points. Longer-dated maturities have broken even further above COVID-era peaks, with the 20- and 30-year now at levels unseen since the mid-2000s. The 10-year, often viewed as a benchmark for the health of the broader bond market & American economy, now trades near 4.6 percent, while at shorter end of the curve is showing similar stress with 2-year bond yield hovering around 4.1 percent and the 5-year bond yield nearing 4.3 percent.
This yield surge is not merely technical. It signals market scepticism about the inflationary consequences of prolonged conflict and Washington’s fiscal trajectory. The U.S. budget deficit has hit $1.2 trillion in the first six months of fiscal year 2026 the third-worst on record with total federal debt standing at a record $39 trillion. Heavy Treasury issuance continues to flood the market to finance these gaps while 10 trillion $ of debt is due for renewal this year further complicating the fiscal maths for Washington. Market pricing now reflects elevated odds at around 36 percent, of the Federal Reserve hiking rates in 2026 rather than rate cuts. This has pushed the average 30-year fixed mortgage rate to 6.68 percent, with expectations of it testing 7 percent soon. Before the war, the mortgages had dipped below 6 percent.
Compounding these pressures, major foreign holders aggressively liquidated U.S. Treasuries in March 2026 amid the Iran conflict and energy shocks. Japan offloaded approximately $48 billion, while China reduced its holdings by $41 billion to $652.3 billion the lowest level since 2008. Overall foreign holdings plunged by $139 billion in a single month, reflecting a broader dedollarization trend as nations scrambled for liquidity to secure scarce energy resources. Turkey dramatically slashed its position from $16 billion to just $1.8 billion to defend the lira against intense pressure, widely attributed to financial warfare linked to its opposition to Kurdish incursion plans in the Iran conflict.
Rising yields with the 10-year nearing 4.6% and the 30-year at 5.17% dramatically increase America’s debt servicing costs on its $40 trillion mountain, including $10 trillion maturing this year. Every 10 basis point rise adds roughly $40 billion in annual interest expenses. This bond market backlash has repeatedly forced pauses in escalation rhetoric, as investors price in prolonged Hormuz disruptions, higher inflation, and fiscal strain. Regional players like Turkey, Saudi Arabia, Qatar, and Egypt are pushing negotiations over renewed hostilities, using backchannels to engage Iran. The bond vigilantes are effectively red-flagging further overstretch, signalling deep skepticism toward prolonged conflict amid eroding foreign demand for U.S. debt.
The bond market’s verdict is clear that the Iran conflict is inflationary, limiting the Fed’s ability to deploy massive quantitative easing or provide dollar liquidity support amid global liquidity crunch. American allies such as Japan and the UAE are seeking swap lines and interventions, while overleveraged hedge funds face margin calls ahead of end-of-quarter i.e. Q2 reporting in June end 2026. Rising yields widen the spreads and complicate bailouts, increasing the risks of a painful unwind. This environment also threatens funding for critical sectors like artificial intelligence and data centre expansion, where nearly 50 percent of Data centre buildouts are already delayed into 2027-28. A popping of the AI bubble looms as a real possibility if liquidity tightens further. The U.S. bond market, once seen as the world’s safest asset class, is flashing warning signals that could constrain America’s policy arsenal precisely when it is most needed.
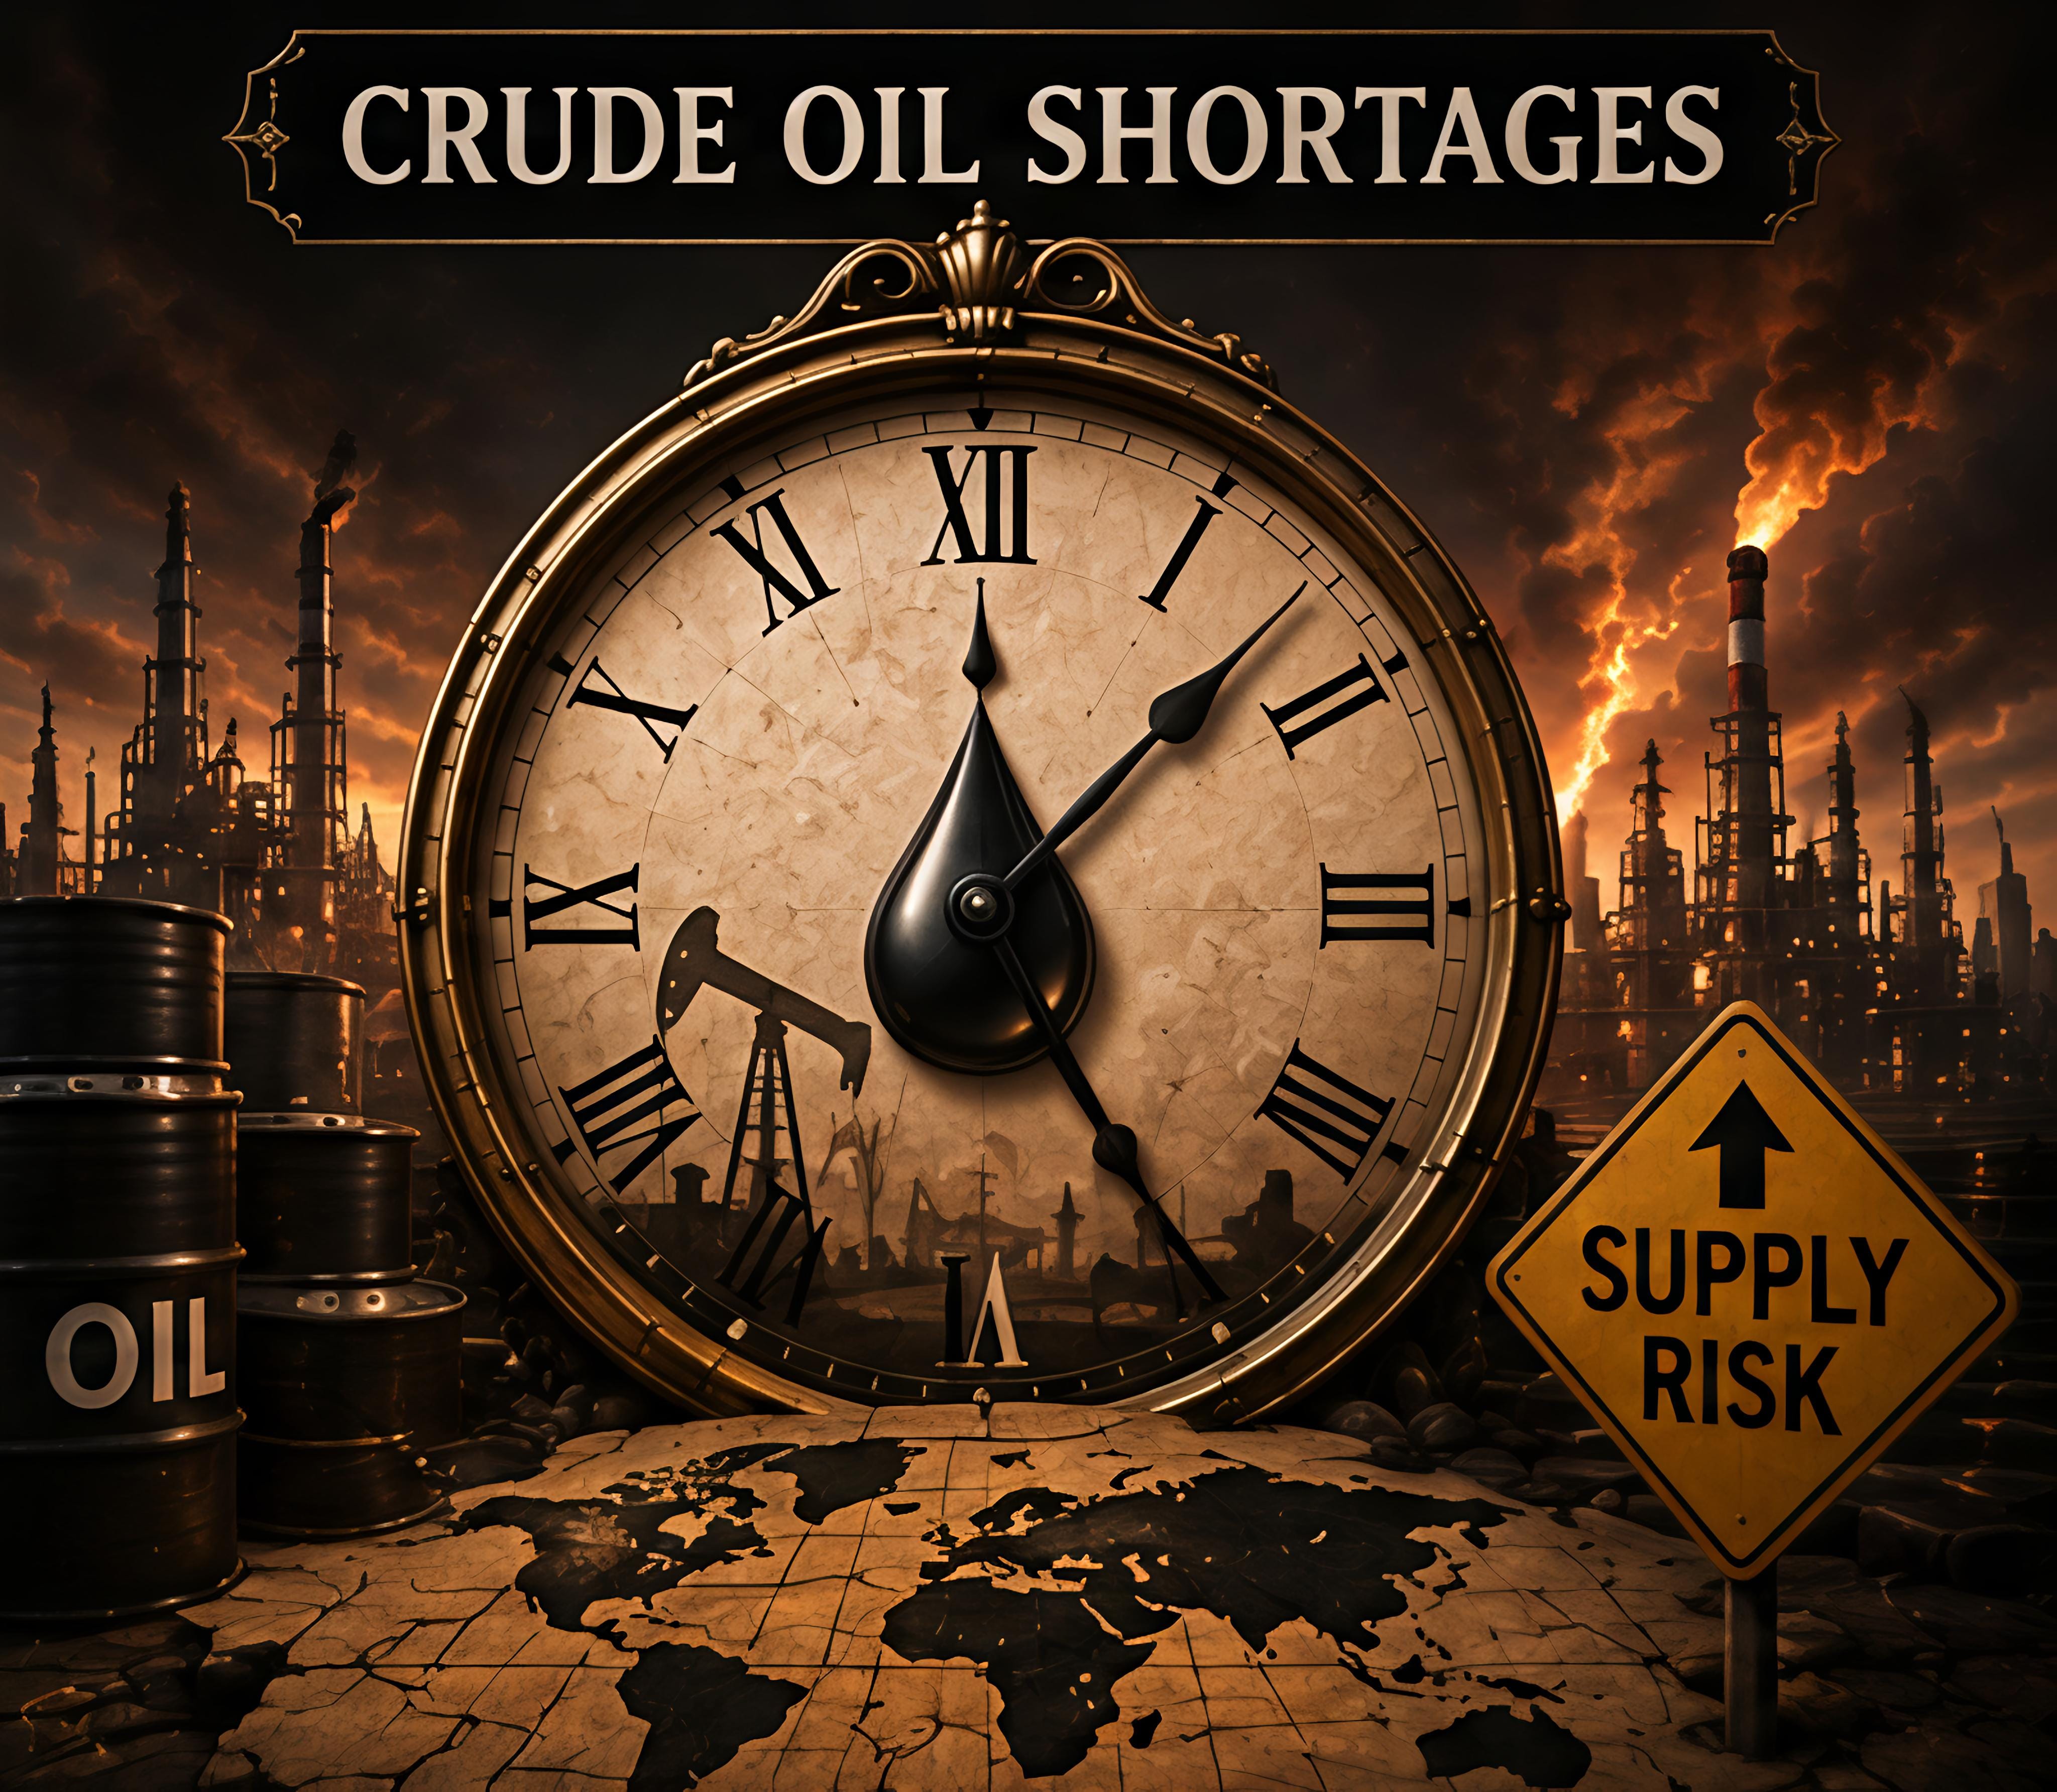
Clock 3: The Approaching Crude Oil Shortage and Exhaustion of Global Buffers
The third clock concerns physical energy realities that crude futures prices on trading screens have yet to fully reflect. A widening spread between physical crude oil price and benchmark Brent and WTI contracts hints at an imminent snap higher as inventories draw down while the Hormuz Strait remains largely closed. The effective blockade since early March has cut off approximately 20 million barrels per day of seaborne oil, representing roughly 20 percent of global marine trade. Despite increased output from the United States and Brazil, and some demand destruction at prices peaking between $100 and $138 per barrel, the market faces a net supply loss of 8 to 11 million barrels per day or more. Cumulative losses now range between 650 million and 1 billion barrels against baseline global demand of 104 to 105 million barrels daily.
The United States has responded by aggressively tapping its Strategic Petroleum Reserve (SPR). The Trump administration authorized the release and loan of up to 172 million barrels to stabilize volatility. SPR inventories have fallen to 384.1 million barrels from around 415 million earlier in the year, with weekly draws peaking at 9.9 million barrels and routinely hitting 8 to 10 million. The SPR’s salt caverns have a total capacity of 714 million barrels and a maximum draw rate of 4.4 million barrels per day, but refill rates are painfully slow at roughly 0.8 million barrels per day. At current trajectories, reserves could plunge to the 2023 modern low of 347 million barrels by late June or mid-July 2026. Dropping of SPR reserves below 250 to 300 million barrels by August-September 2026 would risks structural integrity issues in the caverns, approaching the strict policy floor of 238 million barrels.
Global commercial inventories of crude started 2026 at 8.4 billion barrels, but only about 800 million are practically usable without disrupting supply chains. Roughly 280 million barrels have already been drawn, with analysts projecting severe stress by mid-June and a full crisis by early July. By then, depleted buffers, an exhausted SPR, localized shortages, and potential panic buying could materialize. Domestic fallout in US is already visible as national gasoline averages have breached $4 per gallon, with some states reporting $6 prices and diesel up 45 percent. Continued draws through the summer driving season threaten $4.50-plus gasoline nationally.
U.S. crude exports remain robust at 5 to 6 million barrels per day or higher, but this masks underlying vulnerabilities. Sanctions waivers on the Russian oil and allowances for limited Iranian tanker transits to China reveal the underlying strain of fast dwindling crude inventories. China has far larger crude oil strategic reserves estimated at 1.3 to 1.4 billion barrels, roughly three times the U.S. SPR along with secure access to Russian crude and Iranian supplies, granting the Beijing greater endurance in a contest with America of who blinks first. America’s strong domestic production provides a buffer, yet its strategic reserves are thinning rapidly.
The Venezuelan crude production is way low to bridge the disruption caused from the Middle East and Strait of Hormuz. It will take years for Venezuelan crude production to ramp up significantly given long drilling and refining timelines. The reality is that America is draining its SPR to fulfil the demands of its Asian allies in a bid to keep the Brent crude prices from blowing up. The physical reality of exhausted oil buffers versus paper market pricing creates a dangerous asymmetry. As summer progresses into August and September, with the SPR potentially entering deeper critical zones, the risk of cavern integrity loss and diminished emergency response capacity grows. This clock is accelerating toward a breaking point that could amplify inflation, pressure bond yields further, and expose the limits of U.S. energy leverage.

Clock 4: The Geopolitical Clock of Alternatives to the Dollar Pipeline
A longer-term but steadily advancing clock is measuring the erosion of dollar hegemony through parallel financial and energy architectures. The upcoming BRICS summit in New Delhi on September 12-13, 2026, stands as a focal point. Russian President Putin is confirmed to attend the meeting, and speculation swirls around whether Chinese President Xi Jinping will join him along with Prime Minister Narendra Modi as the host in a move that would carry significant symbolic weight. Observers will closely scrutinize the joint statement of the BRICS Summit in India which could lay out the timeline of deployment and implementation of BRICS Payment settlement system and the broader efforts to reduce reliance on dollar rails. Washington perceives these developments by BRICS grouping specially Russia, India, China & Iran as direct threats to the dollar’s reserve currency status and the SWIFT system that underpins America’s financial sanctions enforcement regime.
Two shadow systems illustrate this shift. The “Tehran Loop” enables Iran, primarily through the Islamic Revolutionary Guard Corps and National Iranian Oil Company, to sell discounted crude despite sanctions. Oil loaded at terminals like Kharg Island is sold at discounts to Asian buyers, especially Chinese teapot refiners. It moves via dark fleets using ship-to-ship transfers, blending, and reflagging, often near coast of Oman. Payments are made in yuan or other non-dollar currencies flow through hawala networks, front companies, and instruments like Tether, then layer through Hong Kong, CIPS payment settlement in China, and eventually recycle into the City of London and European financial centres via law firms, offshore havens, and real estate. This injects resilience into the Iranian regime while circumventing Western controls.
Parallel to Tehran Loop is the “Delhi Loop” between India and Russia. Since 2022, India has imported discounted Russian crude, settled in rupees via Special Rupee Vostro Accounts at Indian banks. Russia receives rupees for oil exports, these rupee surpluses are further invested in Indian government securities or stocks, financing India’s fiscal needs at lower borrowing costs while earning returns for the Russians. This mechanism setup by the RBI in August 2025 hedges India against dollar liquidity shocks, secures stable energy supplies at lower landing costs, and recycles Russian oil surpluses into Indian debt markets. Both loops interconnect within the broader BRICS diversification, eroding petro-dollar exclusivity as oil trades increasingly in rupees, yuan, or other currencies.
U.S. efforts to target these loops through sanctions on Iranian oil, Russian energy, and Chinese refiners aim to weaken parallel systems and bolster American energy dominance. America by way of these sanctions and trade actions like 301 investigations, tariffs and deals seeks India & China to desist from defying the Petrodollar system and increase the offtake of US Oil & LNG. Yet such coercive measures by America risk straining relations with key partners like India and Gulf allies like Saudi Arabia which already engaging in petro-yuan deals with China.
America is already pressurising Saudi Arabia by aiming to break the monopoly of OPEC/OPEC+ by making the Emiratis break away from the Oil producing cartel in the Gulf region. The effort is to break the dominance of Saudi and the OPEC+ cartel in determining Oil price specially after Crown Prince Mohammad Bin Salman twice tried to break the US Shale by way of a price war in 2014-16 & 2020. Saudi Arabia since then has diversified oil trade apart from dollar to other currencies as well like Yuan with China and setting up regional alliances with Pakistan, Egypt & Turkey to hedge Israel & USA.
The freezing of Russian Eurodollar reserves in 2022 after Ukraine war has accelerated these trends, pushing nations across the world to de-risk an unreliable America. Countries across the world are asking for repatriation of its Gold from United States. Germany & Italy are repatriating their gold reserves from America as central banks across the world from China, India, Brazil, Russia and Turkey are piling upon the yellow metal as neutral reserve asset while dumping US treasuries. With each sanction waiver issued by America on the Russian Oil, countries like India & China are now openly defying US on Russian & Iranian Oil sanctions. Thus American sanctions enforcement regime is beginning to crack as world desperately looks for alternatives in a bid to de-risk the United States.
These developments, amplified by the Hormuz blockade by Iran, highlight a multipolar pushback against dollar-centric pipelines. Ironically in both the Tehran Loop and the Delhi Loop the end beneficiary of Russian Oil refined in India or of the Iranian Oil money are the European financial system in City of London and the aristocratic elite in Brussels where the unhedged oil money of Iran or the refined Russian oil from India lands. This clock underscores Washington’s challenge in maintaining financial supremacy amid kinetic and sanctions-based strategies that appear increasingly counterproductive.
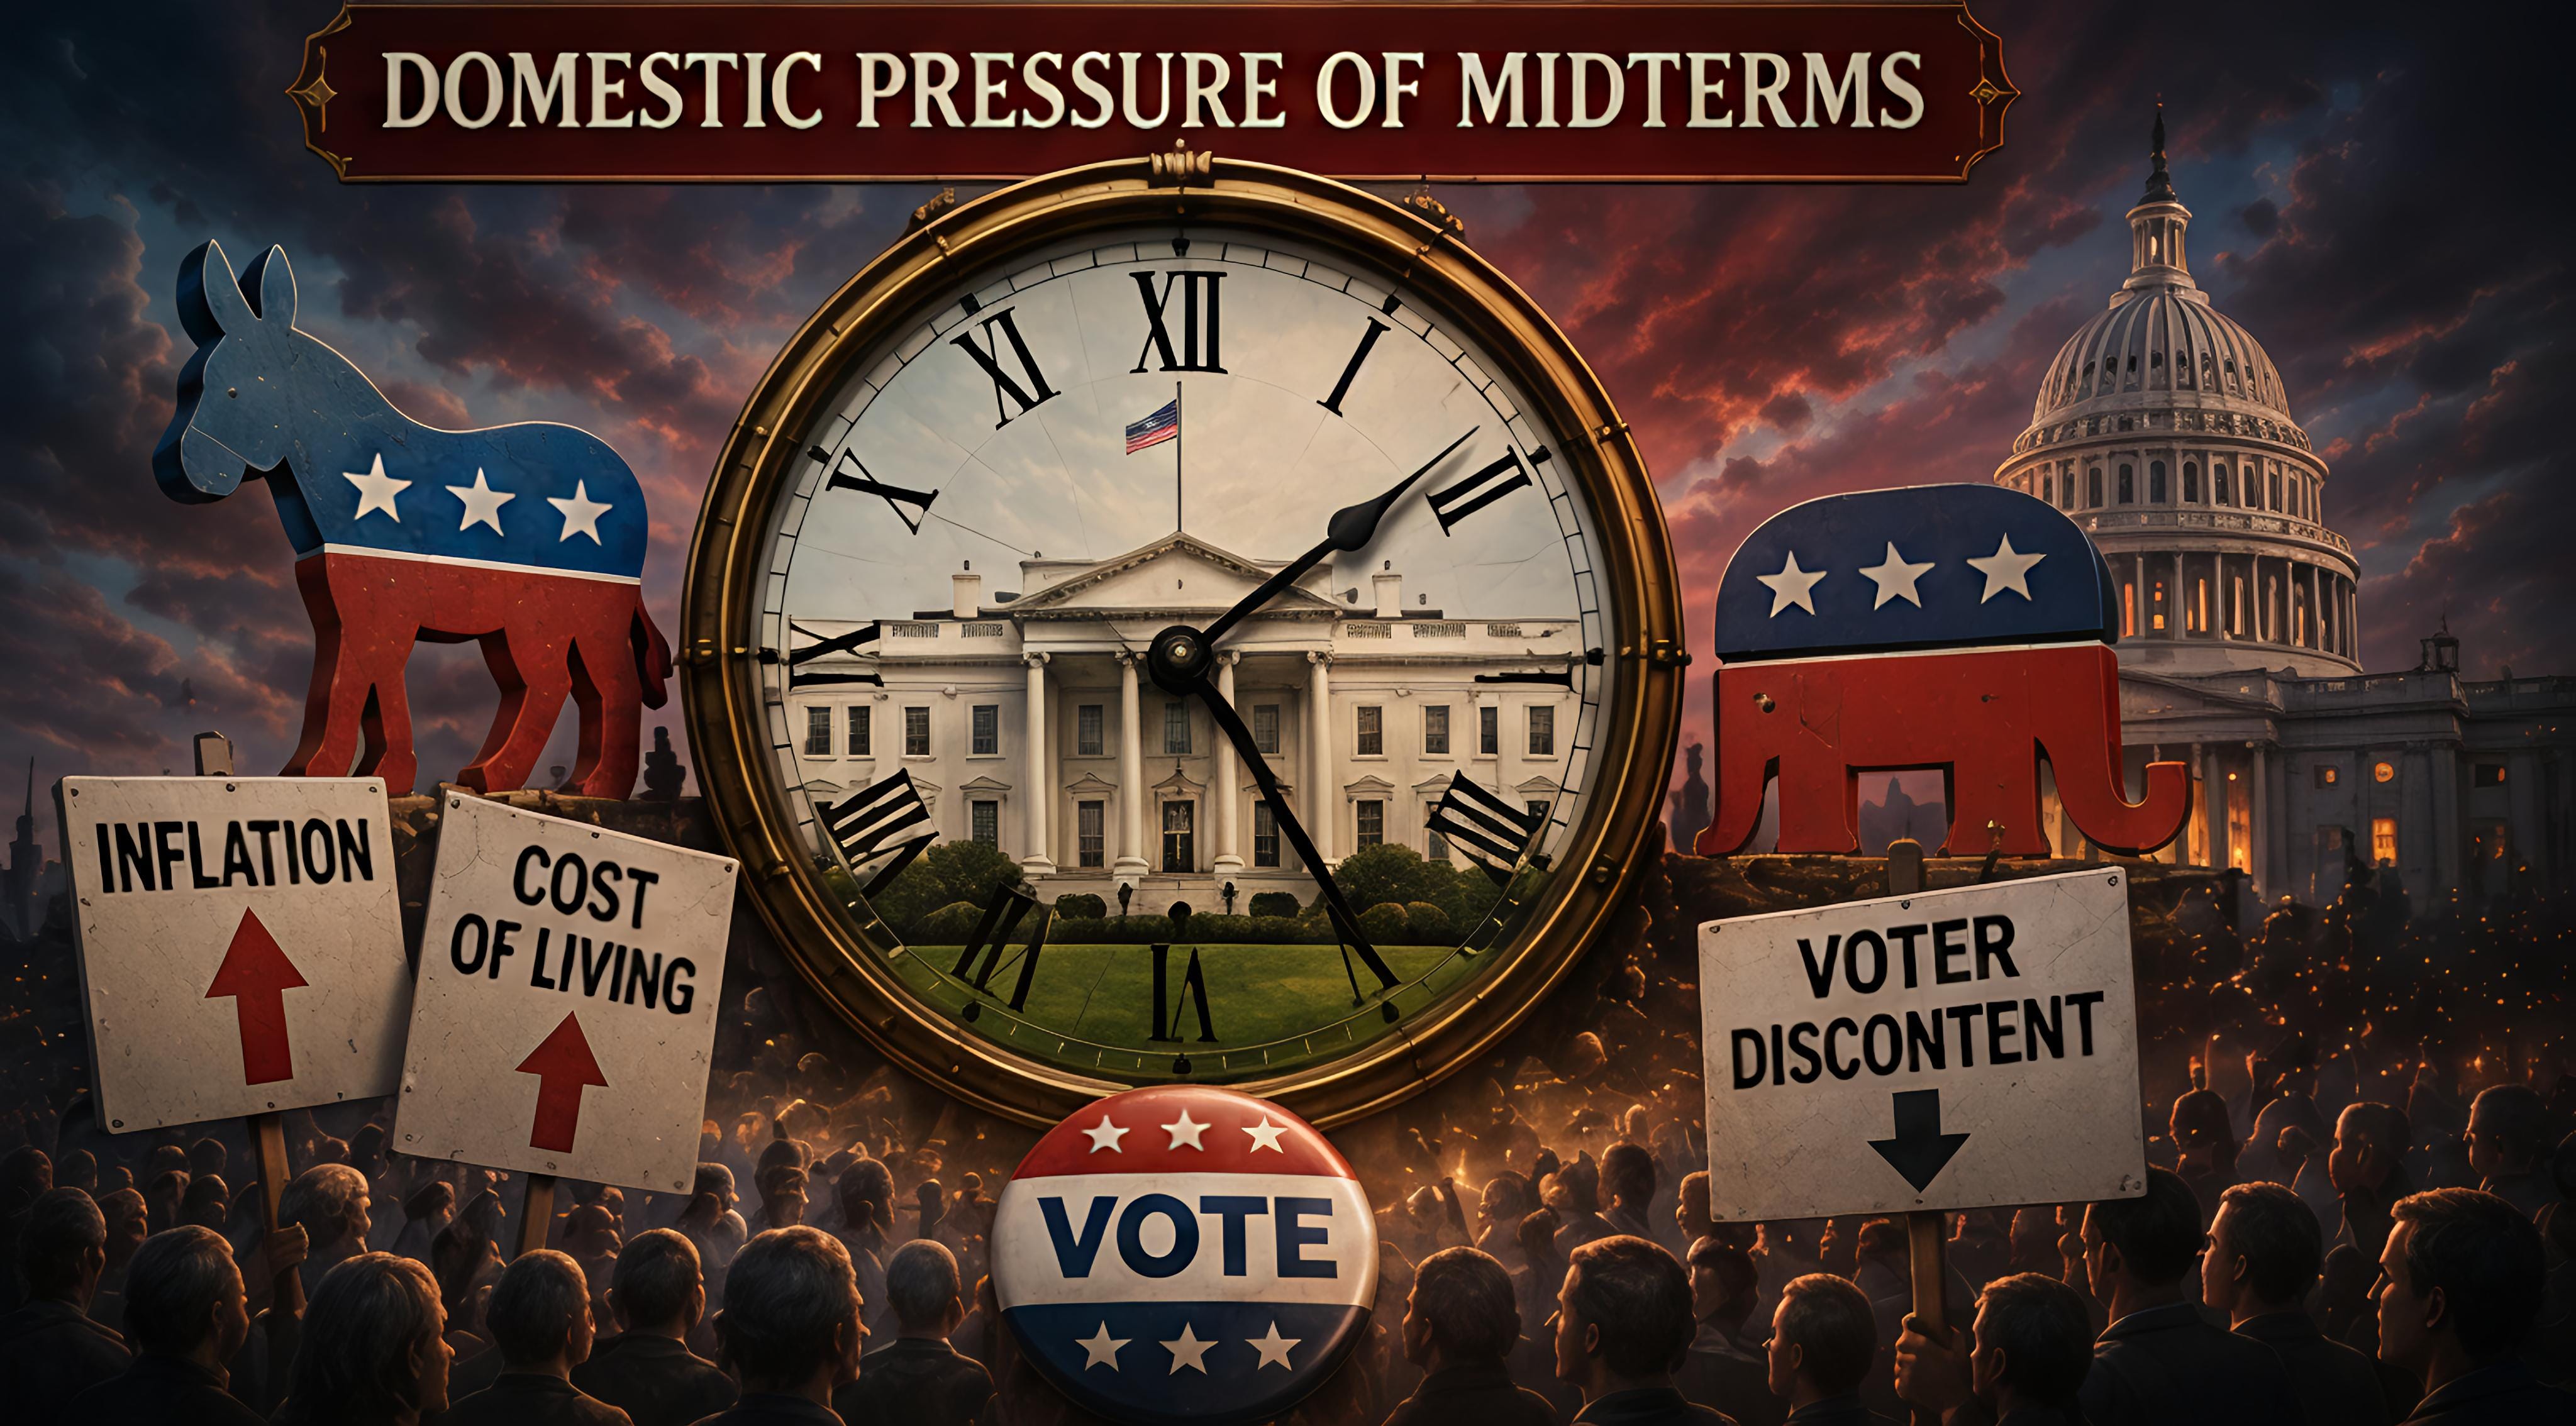
Clock 5: Midterms & the Domestic Backlash
The fifth clock ticks toward America’s domestic political calendar. As the Iran war prolongs, inflation climbs, bond yields rise, and allies show signs of fatigue, public discontent is mounting. President Trump’s approval ratings on affordability, jobs, and economic management are plummeting. Republicans appear vulnerable to losing the House of Representatives in the 2026 November midterms elections, with risks extending to losing the Senate even. Such an outcome would trigger a wave of Democratic subpoenas targeting Trump administration officials, potential impeachment motions, and a legislative gridlock that could turn Trump presidency in to a lame duck one.
This political backlash would derail key elements of the policy agenda, including trade initiatives and fiscal measures. Heading into a lame-duck period after November 2026, the path to retaining the White House in 2028 will grow even narrower for the Republican party. Rising energy costs, higher borrowing rates, and perceptions of strategic overreach amplify the voter frustration. The interplay between external pressures like bond yields, oil shortages, de-dollarization initiatives abroad and internal politics creates a self-reinforcing cycle. Each month of sustained conflict adds fuel to opposition narratives, constraining the executive manoeuvrability precisely when decisive action on energy, debt, and alliances may be required.
Conclusion: Converging Clocks and the Path to Multipolarity
These five clocks tick in close synchronization, their combined pressure testing the resilience of the Pax Americana system. Energy shocks feed inflation and bond market stress, a potential yen carry trade unwind could limit foreign financing and blow up the US treasury market, depleting crude oil & SPR buffers risk physical shortages, de-dollarization initiatives in BRICS and global south gains momentum, and the domestic politics back home threatens a gridlock for President Trump in America.
The state visit of President Trump to China and the meeting with President Xi Jinping has not yielded any diplomatic breakthrough or an off ramp for him in the Iran conflict. Iran continues to play hardball with United States after having gained the leverage over Strait of Hormuz and the Americans are allowing its naval blockade to leak by facilitating Iranian crude oil shipments to China by sea as well land corridors through Pakistan. President Xi in his remarks clearly laid out the red lines for America on Taiwan as inalienable part of China and reminded President Donald Trump that China is a rising power and America is a declining one in his subtle reference to the ‘Thucydides Trap’.
There are many factors which could alter the trajectory of these scenarios extending the timing of these clocks a bit longer. Such X factors could be like where China-America agree to a bigger deal on President Xi’s likely visit to US in September 2026 firming a G2 understanding, or where China skips BRICS summit in India, or the BRICS Summit in September 2026 postpones the timeline of implementation of alternate payment settlement system. Further a Treasury Bailout of Bond Markets, Fed intervention with Bank of Japan and more importantly will Strait of Hormuz open up by June-July 2026, after which the physical crude shortages begin to rip up the price of brent on the screen reflecting the true price of actual barrels. The bigger issue that could determine the trajectory of these scenarios is the resumption of flow in Strait Of Hormuz and when the Lloyds in London thinks that the strait is now re-insurable reducing the war risk premiums for flows to resume. As the saying goes Force is not equal to Flow.
However, Iran is unlikely to give up the leverage of controlling the straits & imposing toll on it so easily. What will the Gulf allies do in case this war prolongs or the Israeli’s escalate putting the whole region in line of fire of an Iranian Retaliation. That could take the Oil facilities in the middle east totally offline risking a disruption where the price on the screen or the flow will not matter at all if there is no production left or disrupted to due to potential Iranian strikes on energy facilities across the gulf region. This actually complicates the Pentagon’s strategy of achieving a decisive victory in the Persian gulf conflict with Iran.
Thus repeated Russian oil sanction waivers given by America is not out of choice rather it reflects its compulsions to maintain the spread between the screen price of Brent & looming physical shortages of crude. The clocks are ticking and sooner than later America will face its moment of reckoning. UK one of the America’s closest ally has issued a permit allowing imports of diesel and jet fuel produced from Russian crude oil in third countries and the said licenses go into effect on 20th May 2026. It will not be surprising if the Europeans follow suit on Russian gas & oil. American allies are now openly defying US sanctions on Russian & Iranian oil when the scarcity of supply hits home and it becomes a matter of survival. America’s capacity to enforce rules through kinetic escalation, sanctions, and supply chain restructuring shows limits in a world seeking alternatives.
The era of unipolar dominance is fading. A chaotic transition toward multipolarity with China in Asia and Russia in Eurasia, Iran asserting its regional influence, and India emerging as a Global South leader appears underway. Whether this evolves into managed coexistence or continued friction remains uncertain. Countries, investors, and analysts are already war gaming these scenario. The summer and the fall of 2026 may mark a pivotal inflection point, as Washington confronts the constraints of its own ambitions in an increasingly contested global landscape. The clocks are not merely ticking they are converging, demanding adaptation in an age where American exceptionalism faces its sternest tests yet.
References:
1. Japan 10-Year JGB Yield Reaches 2.80% (Highest in Nearly 30 Years) — Nikkei Asia, May 18, 2026. https://asia.nikkei.com/business/markets/bonds/japan-long-term-bond-yields-hit-record-highs-amid-fiscal-concerns
2. Japanese Net Sales of U.S. Debt: ¥4.67 Trillion ($29.6 Billion) in Q1 2026 — Aggregated TIC data and market reports (Kobeissi Letter context), Q1 2026.
3. China Cuts U.S. Treasury Holdings to $652.3 Billion in March 2026 (Lowest Since September 2008) — Reuters / U.S. Treasury TIC Data, May 18, 2026. https://www.reuters.com/world/china/japan-china-lead-declines-foreign-holdings-treasuries-march-data-shows-2026-05-18/
4. Japan Trims $47.7 Billion in U.S. Treasuries (Holdings Fall to $1.192 Trillion) — Reuters / U.S. Treasury TIC Data, May 18, 2026. https://www.reuters.com/world/china/japan-china-lead-declines-foreign-holdings-treasuries-march-data-shows-2026-05-18/
5. Total Foreign Holdings of U.S. Treasuries Decline to $9.348 Trillion in March 2026 (from $9.487 Trillion in February) — Reuters / U.S. Treasury TIC Data, May 18, 2026. https://www.reuters.com/world/china/japan-china-lead-declines-foreign-holdings-treasuries-march-data-shows-2026-05-18/
6. U.S. 30-Year Treasury Yield Hits 5.19% (Highest Since July 2007) — CNBC, May 19, 2026. https://www.cnbc.com/2026/05/19/treasurys-yields-inflation-traders-fed-interest-rates.html
7. U.S. 10-Year Yield Rises ~75 Basis Points Since Start of Iran Conflict (Near 4.6%) — Market reports via CNBC and WSJ bond coverage, May 2026.
8. U.S. CPI Inflation Rises to 3.8% and PPI to 6.0% (Highest Since 2023) — BLS data reported in Axios and New York Times, May 2026.
9.U.S. Budget Deficit Hits $1.2 Trillion in First Half of FY2026 — Committee for a Responsible Federal Budget (CRFB) / CBO Monthly Review, April 2026. https://www.crfb.org/press-releases/cbo-estimates-12-trillion-deficit-first-half-fy-2026
U.S. Federal Debt Stands at Record ~$39 Trillion — U.S. Treasury / CBO Ongoing Reports, 2026.
11.U.S. Strategic Petroleum Reserve (SPR) at 384.1 Million Barrels (as of May 8, 2026) — U.S. Energy Information Administration (EIA) / YCharts, May 13, 2026. https://ycharts.com/indicators/us_ending_stocks_of_crude_oil_in_the_strategic_petroleum_reserve
12.SPR Authorized Release up to 172 Million Barrels with Peak Weekly Draws of 8–10 Million Barrels — U.S. Department of Energy (DOE) / Reuters, May 2026. https://www.energy.gov/hgeo/opr/spr-quick-facts
13.Strait of Hormuz Disruption: ~20 Million Barrels per Day of Seaborne Oil Affected — Reuters / Bloomberg Energy Market Analysis, March–May 2026.
14.Global Oil Demand Baseline at 104–105 Million Barrels per Day — EIA / IEA World Energy Outlook and Monthly Reports, 2026.
15.China’s Strategic Oil Reserves Estimated at 1.3–1.4 Billion Barrels — Industry and EIA-equivalent estimates, early 2026.
16 .BRICS Summit Scheduled for September 12–13, 2026 in New Delhi (Putin Confirmed to Attend) — Official BRICS India Portal and MEA, 2026. https://www.brics2026.gov.in/
30-Year Fixed Mortgage Rate Climbs to 6.68–6.75% — CNBC Mortgage and Yield Coverage, May 2026.
Market-Implied Odds of Fed Rate Hike in 2026 Rise to ~36–37% — CME FedWatch Tool via CNBC, May 2026.
U.S. Gasoline Prices Exceed $4/gallon Nationally (Some States $5–6; Diesel +45%) — AAA / BLS Data Tied to Iran Conflict, May 2026.
USD/JPY Rebounds Toward 169 Despite BoJ Interventions — Reuters and CNBC Currency Reports, May 2026.
fantastic analysis......sir can you provide the link to the essential reading of your podcast with aadi, of the 2 families, the fed reserve connect, the city of london, n the BIS...chatham house...n finally the Deep State , both in Europe n US, n how the power centers fluctuates....
your work is a must read for all students of Geopolitics n IR...
THANK YOU, PRANAMS
Wow. A lot to take onboard. I read yesterday that the ruble is now the strongest performing foreign currency against the dollar. I wonder why? In addition European purchases of Russian LNG have increased quite dramatically recently, I believe 16% was the number quoted. Again, I wonder why?